Objective
To evaluate and optimize Facebook and Google AdWords marketing campaigns using Python and Power BI, aiming to improve conversions and reduce cost per acquisition.
Tools Used
- Python (Pandas, Matplotlib, Seaborn)
- Power BI (for dashboard visualizations)
- Jupyter Notebook
Dataset Overview
Daily-level ad campaign data covering 1 year for both Facebook and Google AdWords. Key features include:
- Views, Clicks, Conversions, Spend
- Derived metrics: CTR, CPC, Conversion Rate, Cost per Conversion
Business Questions
- Which platform performs better in terms of CTR and conversion rate?
- What are the monthly trends in cost-efficiency?
- Do higher costs result in more conversions?
- Which campaigns offer the best ROI?
Key Insights (Summary)
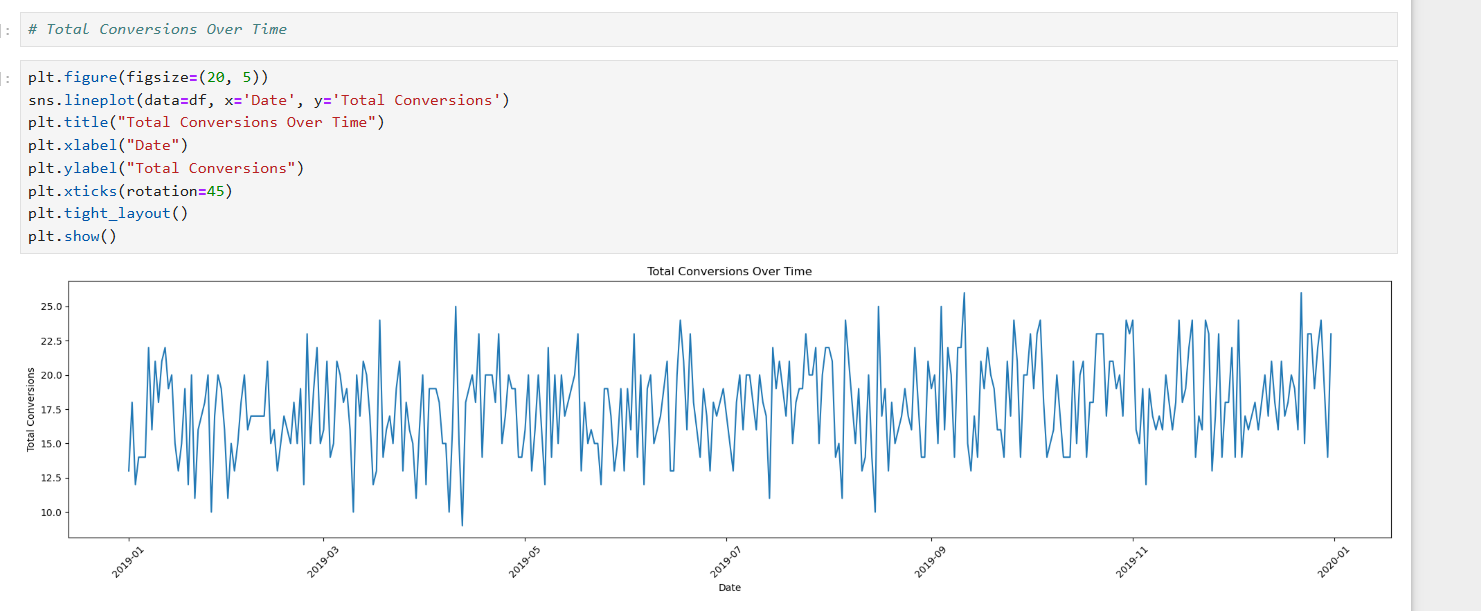
- Conversions increased over the year by ~16%
- Cost per conversion dropped from $14.4 to $12.1
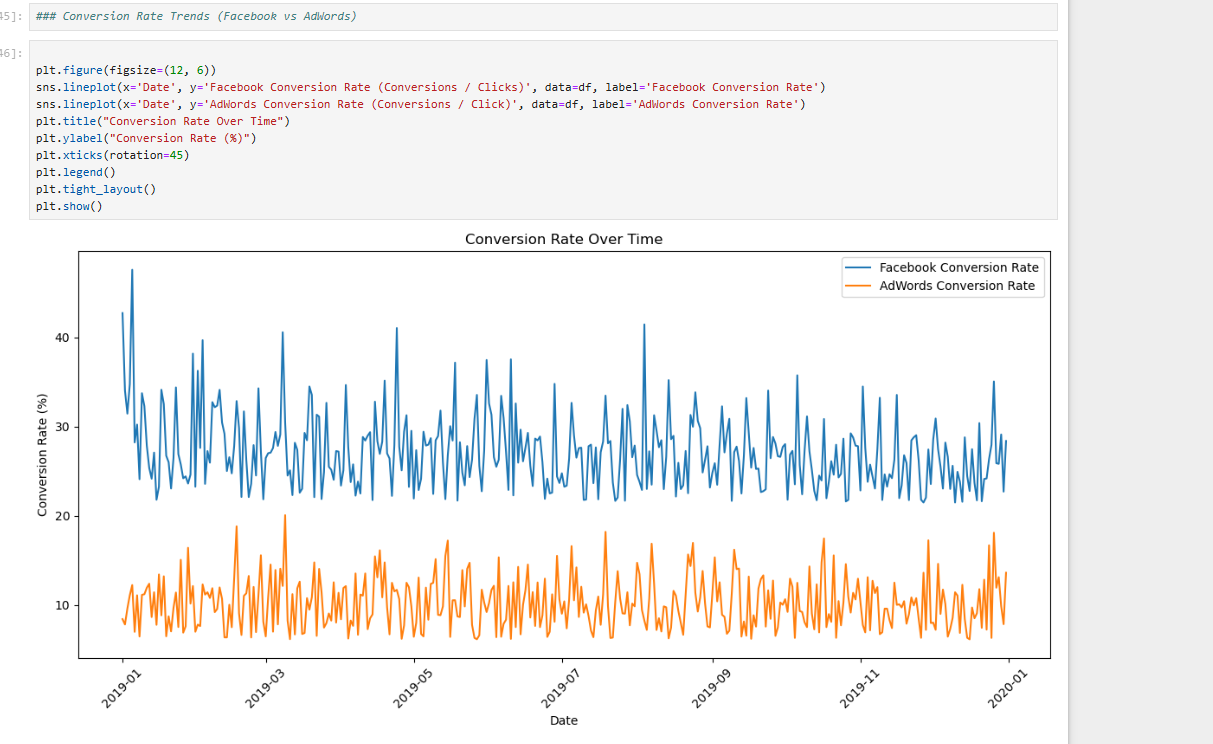
- Facebook outperformed AdWords in both CTR and Conversion Rate consistently
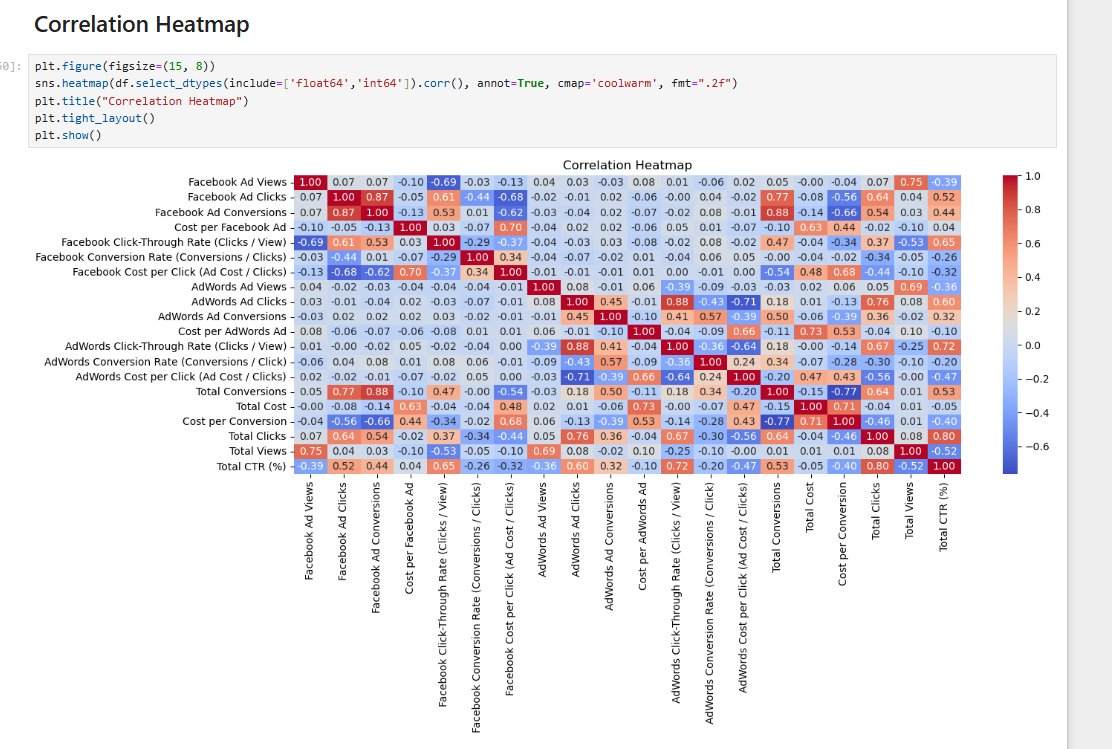
- Clicks showed a stronger correlation with conversions (0.76) than cost
- Lower CPC leads to better conversion efficiency
Python Data Analysis
I used Python to clean the data, perform exploratory data analysis (EDA), and generate insights before building dashboards in Power BI.
Python Tasks Performed
- Data cleaning: handling nulls, formatting types
- Feature engineering: derived CTR, CPC, Conv. Rate
- Visualizations: Line plots, Correlation heatmaps
- Correlation analysis for identifying drivers of conversions
Example Python Visuals
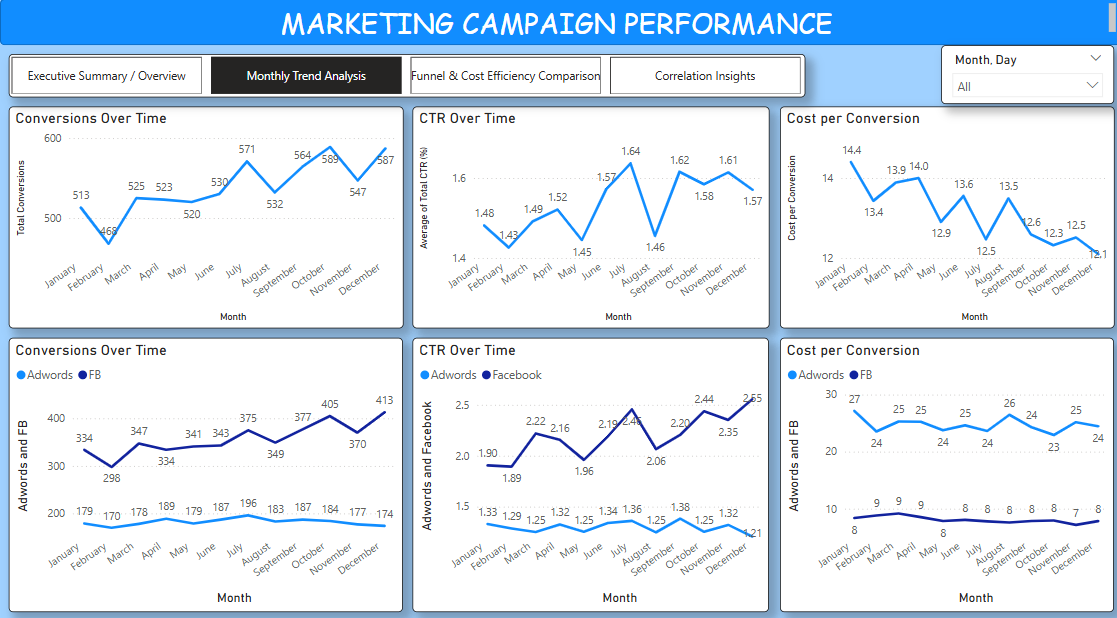
Conversions Over Time
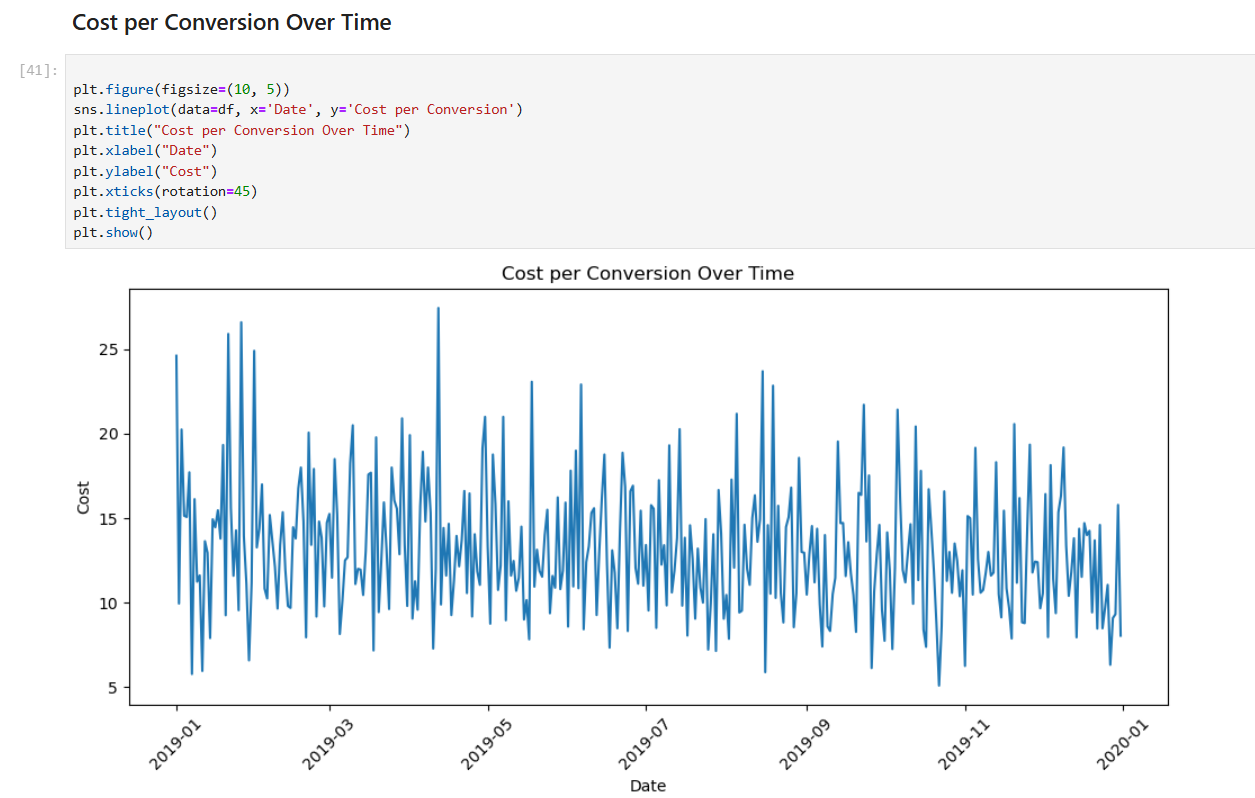
Cost per Conversion Over Time
Click Through Rate (CTR) Over Time
 Over Time.png)
Conversion Rate Over Time
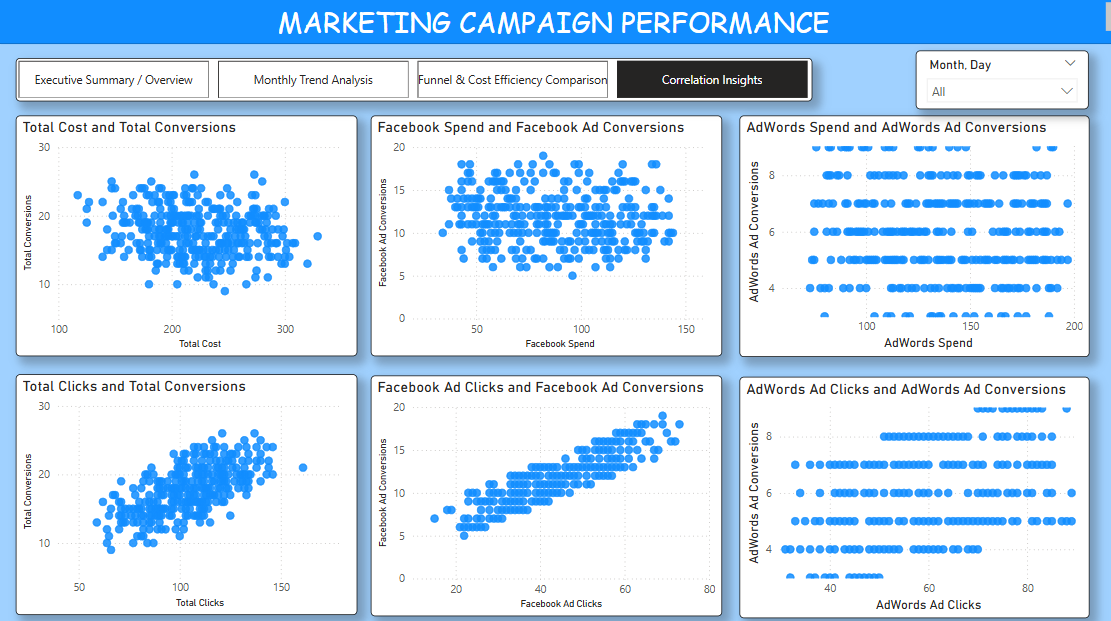
Correlation Heatmap
Python Insights
- Conversions steadily increased across the months
- Strong correlation between clicks and conversions (0.76)
- Negative correlation between CPC and Conv. Rate (–0.54 to –0.64)
- Facebook showed higher efficiency in cost per conversion
Power BI Dashboards
I used Power BI to visualize the cleaned data and answer key business questions interactively.
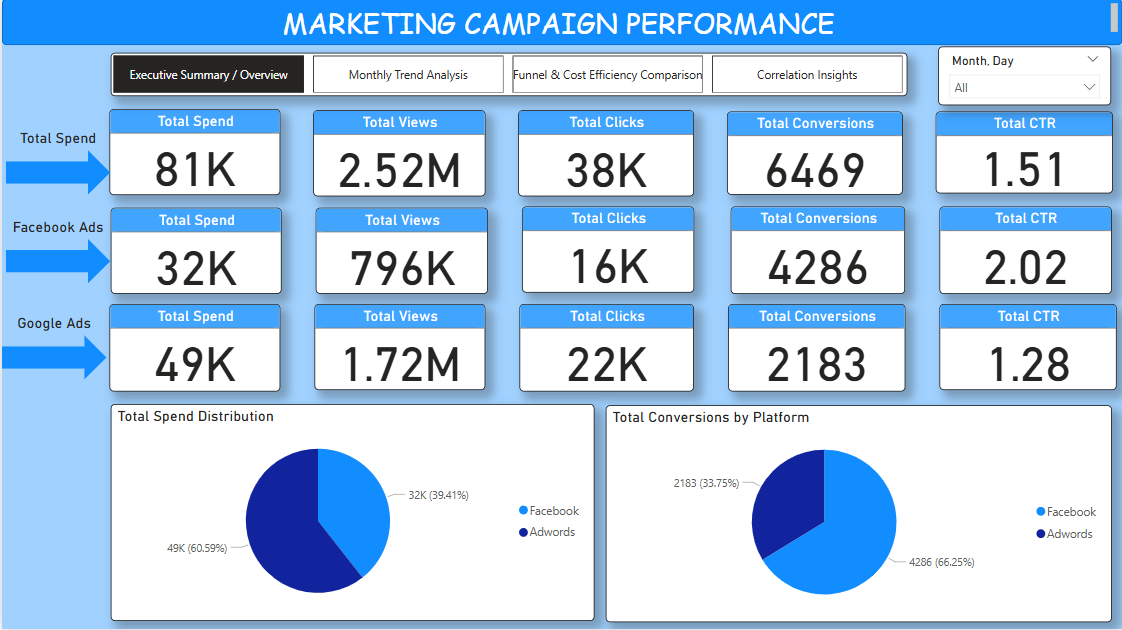
Dashboard Pages:
- Executive Summary
- Monthly Trend Analysis
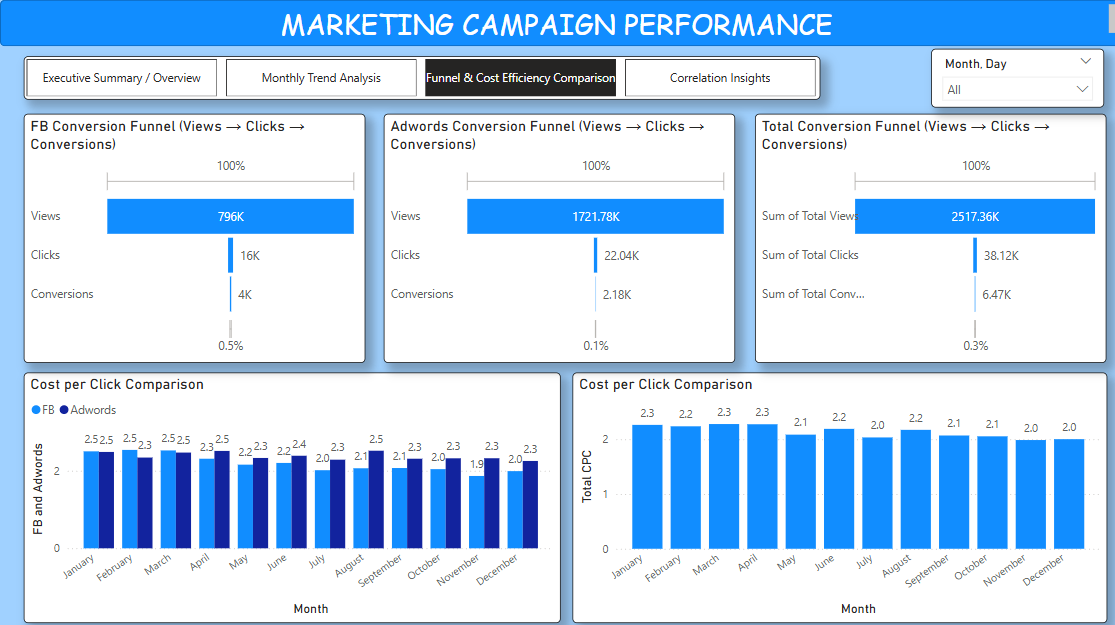
- Funnel & Cost Efficiency
- Correlation Insights
Sample Visuals
 Download Power BI Report
Dashboard Video
Final Recommendations
- Allocate more budget to Facebook for better ROI
- Optimize CPC to increase conversion rate
- Monitor cost-efficiency monthly and watch for seasonal patterns
- Prioritize increasing high-quality clicks, not just spend